


Electricity Maps
Description of Electricity Maps
Electricity Maps is a live visualization tool designed to provide users with real-time insights into the sources of electricity and the associated carbon emissions. This application serves as a resource for individuals and organizations interested in understanding the environmental impact of their energy consumption. Users can download Electricity Maps for the Android platform to access its various features.
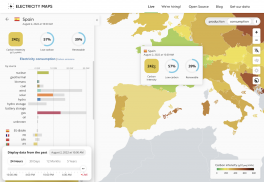
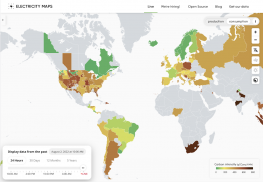
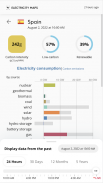
The app offers a detailed breakdown of power production across over 200 regions worldwide. Users can view how much electricity is being generated from different sources, such as renewable energy, fossil fuels, and nuclear power. This information helps users assess the sustainability of their energy use and encourages informed decision-making regarding energy consumption.
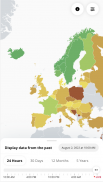
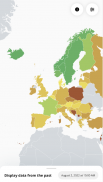
One of the primary functionalities of Electricity Maps is its display of carbon intensity. This feature indicates how much carbon dioxide (CO2) is emitted per unit of electricity consumed, allowing users to evaluate the environmental impact of their electricity usage in real time. The app updates this information frequently, reflecting changes in energy production and consumption patterns throughout the day.
Electricity Maps also tracks total emissions linked to electricity generation. By providing a cumulative view of emissions data, users can better understand the broader implications of their energy choices. This feature is beneficial for individuals seeking to minimize their carbon footprint or businesses aiming to improve their sustainability practices.
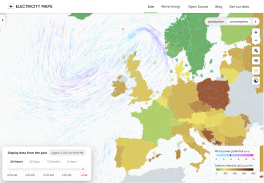
Additionally, the application highlights electricity exchanges between regions. This aspect is critical for understanding how energy is traded across borders and how this affects local carbon intensity. Users can observe how electricity from cleaner sources in one region may help reduce emissions in another area, fostering a sense of interconnectedness in energy production and consumption.
The app is designed with user accessibility in mind, featuring a straightforward interface that allows users to easily navigate through different data points. The interactive maps provide a visual representation of energy sources and emissions, making complex data more digestible. This usability is particularly advantageous for those who may not have a technical background in energy systems.
Electricity Maps also includes a feature for exploring historical data. Users can access past emissions and energy production data, enabling them to analyze trends over time. This historical perspective can be valuable for researchers and policymakers looking to track progress in reducing carbon emissions or transitioning to renewable energy sources.
For those interested in utilizing the data behind Electricity Maps, the application offers a free API for non-commercial use. This API allows users to access the underlying data for research or educational purposes. For commercial applications, a real-time API is available, which includes forecasts and additional features tailored to businesses looking to leverage energy data for decision-making.
The app is continually updated to reflect the latest developments in energy production and emissions reporting. This commitment to providing timely information ensures that users have access to accurate data, which is essential for making informed decisions regarding energy consumption and sustainability efforts.
Electricity Maps fosters a greater awareness of energy sources and their environmental impacts. By providing transparent data about where electricity comes from and the associated carbon emissions, the app empowers users to make more sustainable choices in their daily lives. This increased awareness can lead to collective action towards reducing carbon footprints and promoting renewable energy adoption.
The application is suitable for a variety of users, including environmentally conscious individuals, energy professionals, researchers, and educators. Each group can find value in the detailed data and insights that Electricity Maps provides. Whether it is for personal use, academic research, or corporate sustainability initiatives, the app serves as a valuable tool for understanding and improving energy consumption practices.
In essence, Electricity Maps is a powerful tool that combines real-time data visualization with actionable insights into energy production and carbon emissions. The app encourages users to engage with their energy choices and fosters a deeper understanding of the implications of those choices on the environment. With its user-friendly interface and extensive data offerings, Electricity Maps stands out as a vital resource for anyone looking to navigate the complexities of electricity consumption and environmental impact.
For more information about accessing the data from Electricity Maps, visit their website: https://www.electricitymaps.com/get-our-data.
Electricity Maps - Version 1.208.0
(07-01-2025)Electricity Maps - APK Information
APK Version: 1.208.0Package: com.tmrow.electricitymapLatest Version of Electricity Maps
Other versions


Apps in the same category


